Reading time: 11 minutes
Chapter 2: Introduction to the influData influencer analysis
The Essentials at a Glance
Whether or not an influencer fits your brand can be quickly and objectively evaluated using the right metrics. The influData analysis page provides essential KPIs, scores, and historical data on reach, engagement, authenticity, and much more.
- The influData Quality Score (1–10) gives you a quick overview of an influencer’s overall quality.
- Mini-scores show posting frequency and audience engagement in detail, broken down by content format and compared with similar profiles.
- Audience data reveals demographic structure and detects fake or mass followers.
- Content and brand analysis provides insight into visual quality, brand partnerships, and brand environment.
Have you identified a shortlist of influencers you want to collaborate with or received suggestions from your agency, and now want to assess their quality and suitability for your brand? With our easy-to-understand KPIs, graphics, and score ratings, you can quickly determine whether an influencer creates relevant content, has stable growth, performs well compared to similar creators, and has an authentic and suitable audience. Here is an overview of the influData influencer analysis page:
Table of Contents
- Profile Overview and KPIs
- Content Overview
- Analyzing Follower Growth
- influData Quality Score
- Similar Profiles
- influData Mini-Scores
- Authenticity and Sponsored Posts
- Analyzing Brand Mentions
- Understanding Smart Media Value
- Understanding the Influencer’s Audience
1. Which metrics are shown in the Influencer Profile Overview?
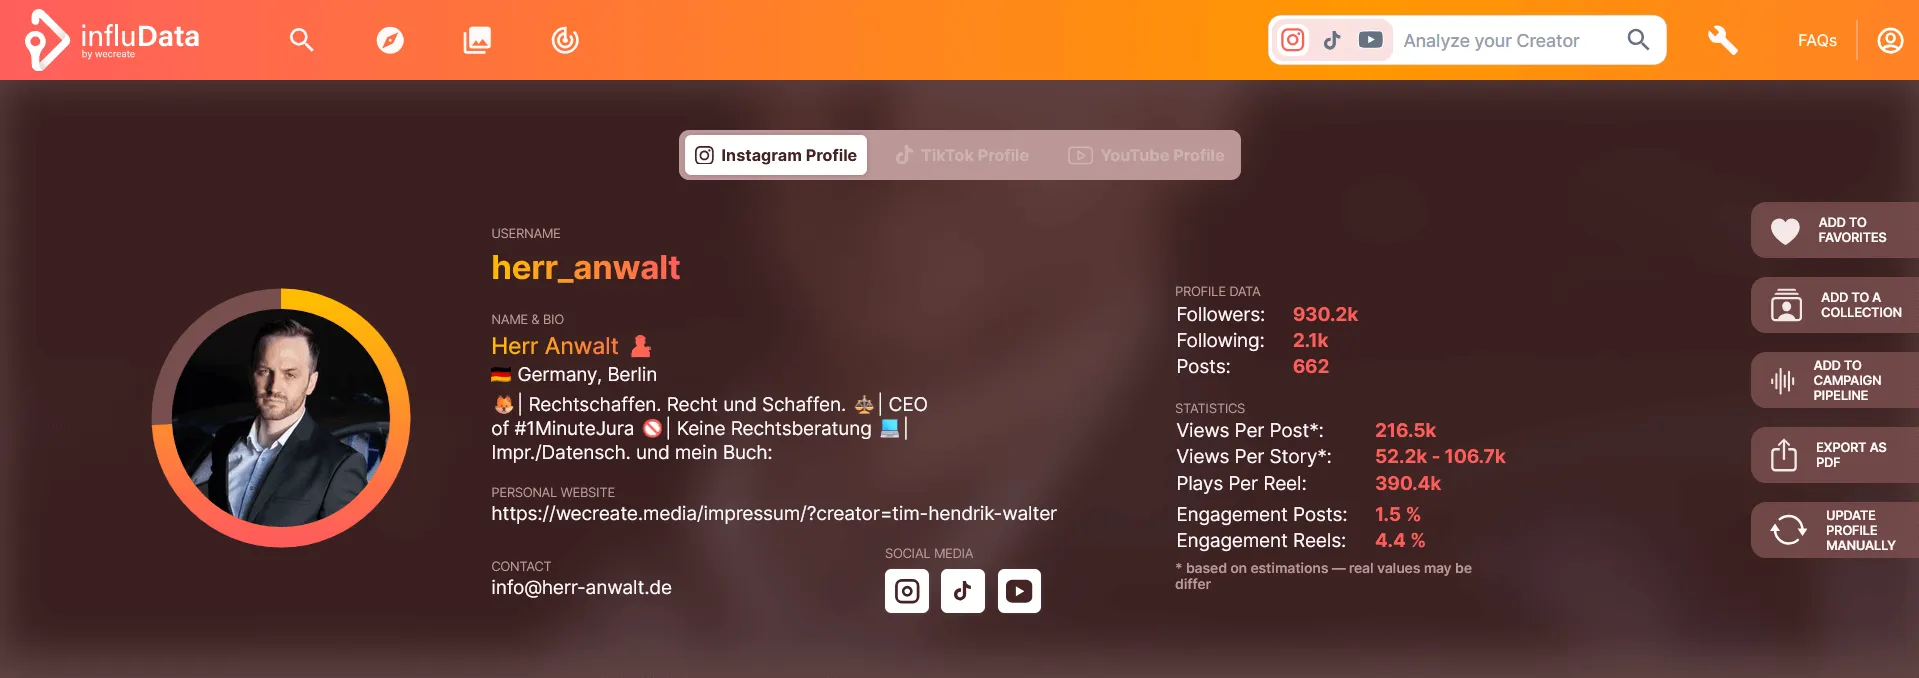
First, on the influencer’s profile page, you’ll see an overview including their profile photo, influData rating ring, name, bio, website links, and, if provided, their email address. In the middle, you can switch between the influencer’s Instagram, TikTok, and YouTube profiles if they have them. Below, you can go directly to their social media profiles via the icons. To the right, you’ll see key data such as the number of followers, accounts followed, and posts.
Next, you’ll receive the first influData insights. On Instagram, these include estimated views per post and story, as well as actual data on plays per reel and engagement on posts and reels. On TikTok, you’ll see engagement and total plays. On YouTube and YouTube Shorts, you’ll find engagement based on subscribers and median views. These insights serve as initial indicators to assess whether a creator has sufficient reach and engagement for your campaign.
On the far right, you have the options to add the creator to your favorites, collection, or campaign, export the profile as a PDF, and manually update the profile to get the most recent data (this usually takes 10-15 minutes).
2. How do you evaluate an influencer’s content?
Check Visual Quality: On the right side, you’ll see the content block. On Instagram, you can choose between the most popular posts and reels, as well as the most recent posts and reels. On TikTok, you can choose between the most viewed and the newest posts. On YouTube, you can choose between the newest YouTube videos and the newest YouTube Shorts. Take a quick look at the influencer’s content to see if it visually aligns with your brand. When you click on a piece of content, you’ll be directed to the original source.
3. How does follower growth develop?
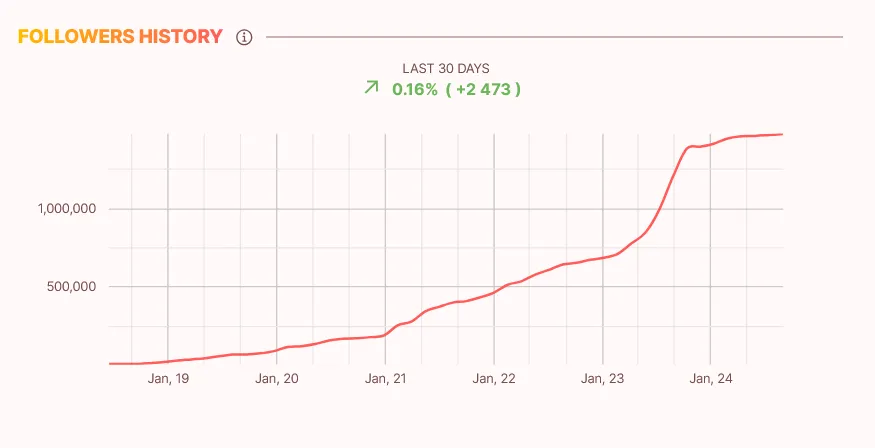
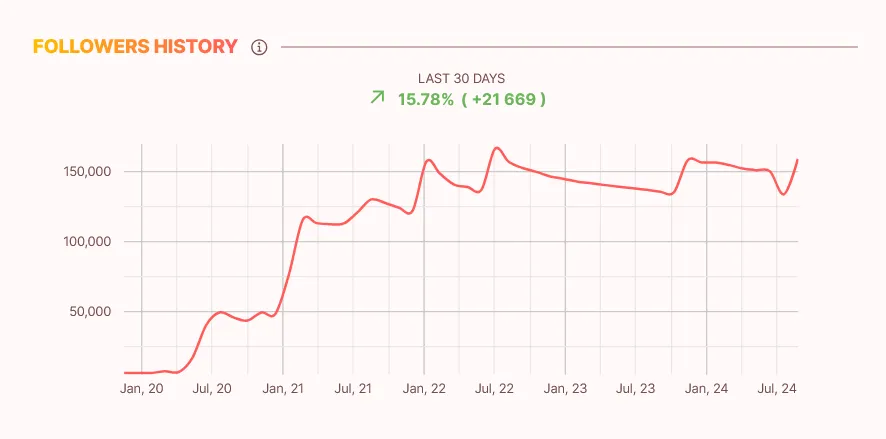
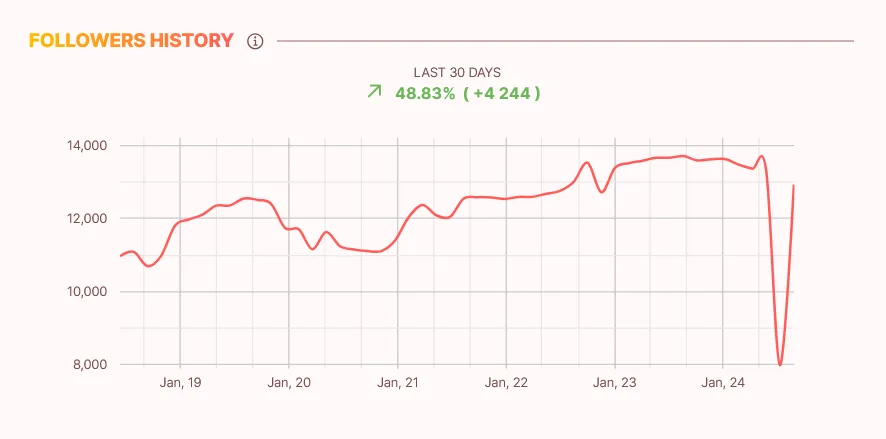
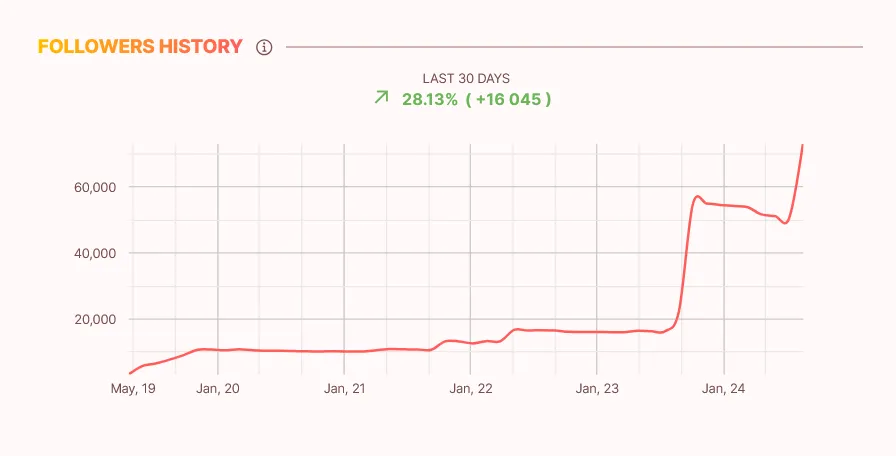
Growth Analysis: Review the influencer’s follower growth to determine whether the profile is developing well and whether the growth is organic or unnatural. Ensure there is consistent growth. Sudden spikes and drops could indicate the purchase of fake followers, while a stagnant trend could indicate a lack of activity or reach. Note: If an influencer has strong media presence, such as being featured in TV news or going viral, this can naturally lead to a significant increase in followers. Keep this in mind and distinguish whether the increase is plausible.
Here is an example of organic growth:
An unnatural progression could look like this, for example:
4. What does the influData Quality Score indicate?re
The Profile Score (also called the Quality Score) is calculated using algorithms that determine the value of an influencer and is optimized to predict the potential success of a collaboration without delving into detailed analysis. The score ranges from a minimum of 1 to a maximum of 10, with 10 representing the highest score.
This score is a composite of all specific scores and helps provide a rough estimate of the influencer’s quality and a comparison with influencers who have a similar number of followers. We recommend only collaborating with influencers who have a score between 5 and 10 as a benchmark. Profiles with scores below 5 typically either have poor performance or potentially fake followers.
5. Why are similar profiles relevant?
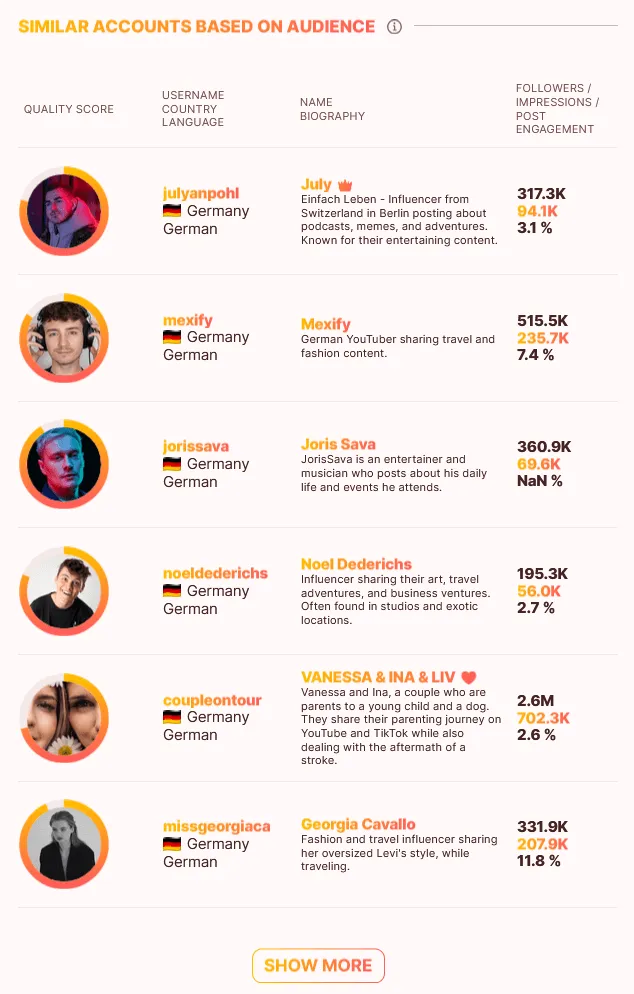
For each profile, we also display similar profiles — these are influencers with a similar audience to the one being analyzed. This can help you find other profiles that might be of interest.
6. What insights do the influData Mini-Scores provide?
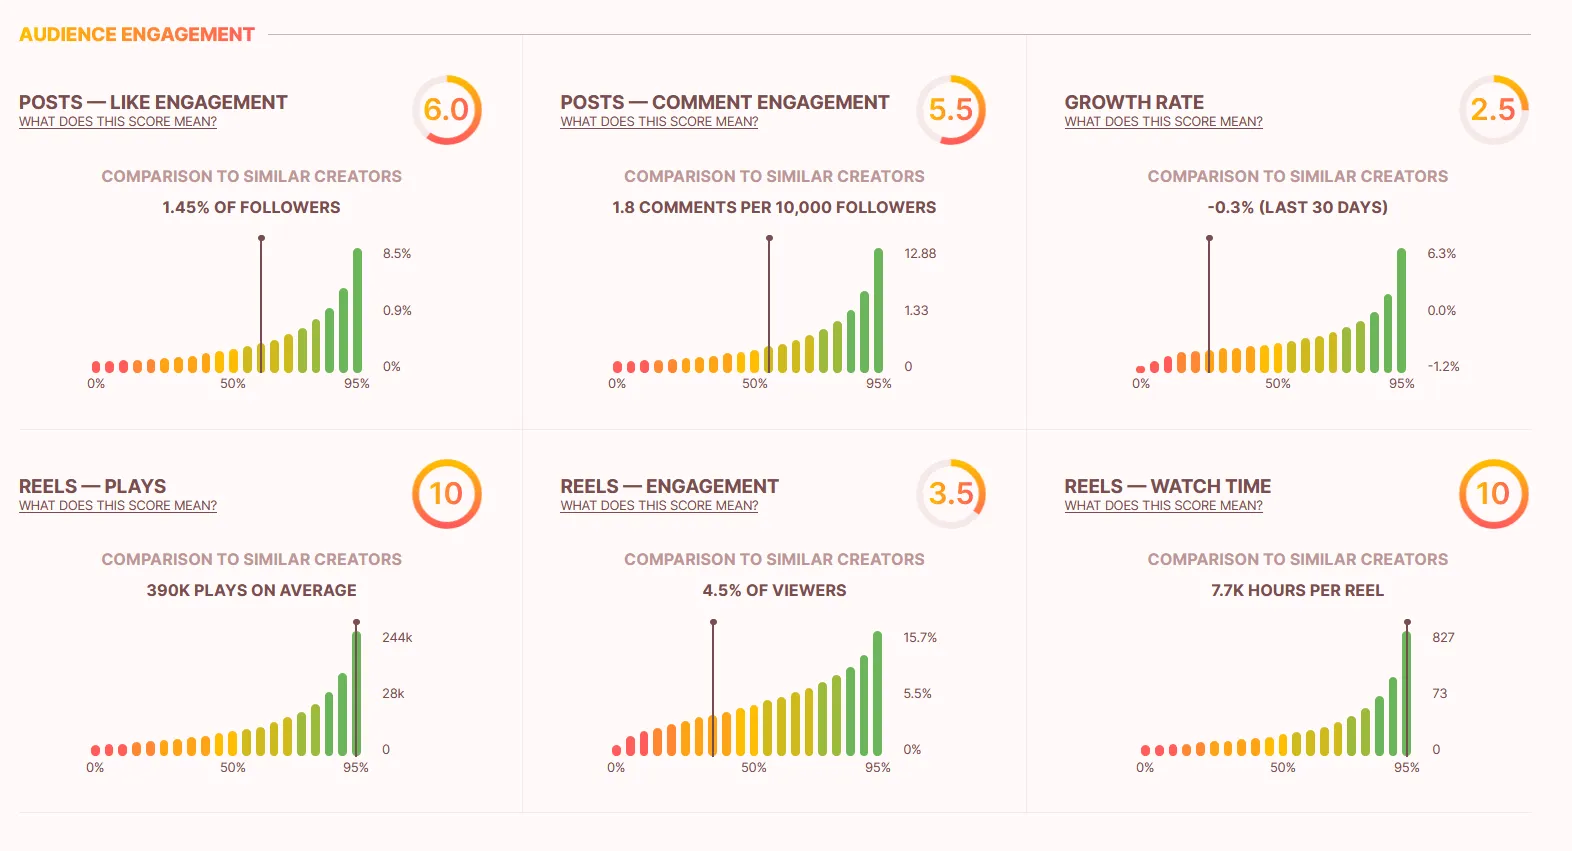
The detailed influData Scores (also called Mini-Scores) evaluate activity and engagement compared to influencers of similar size and industry.
The influData Mini-Scores provide a quick overview of an influencer’s performance in various areas compared to influencers of similar size and industry. The detailed scores are based on the key metrics we have identified as critical for successful influencer marketing. Depending on the goal of your campaign, each of these scores may hold different levels of importance.
Activity Scores:
- Post Frequency: Shows the number of posts per week compared to similar influencers. This metric indicates how often an influencer posts on the respective platform. In our experience, a good influencer should be active but not post too frequently (no more than once or twice a day), as excessive posting may result in lower relevance and influence.
- Story Frequency: Indicates the number of stories posted per day compared to similar influencers. This metric shows how often an influencer posts Instagram stories. Influencers who rarely post stories may have fewer users viewing their stories.
- Reels Frequency: Displays how many reels are posted per week compared to similar influencers. This metric indicates how often an influencer posts Instagram reels. A significant advantage of using reels in marketing campaigns is that the metrics are highly transparent and all relevant data is publicly accessible.

Audience Engagement:
- Like Engagement on Posts: Compares the percentage of followers who like posts with similar influencers. This metric relates the number of likes per post to the influencer’s total followers. A high value indicates that a large number of followers are seeing and interacting with the post. Additionally, it suggests that a relatively small percentage of followers are inactive, and the content may also be reaching users beyond the follower base (virality).
- Comment Engagement on Posts: Indicates the number of comments per 10,000 followers compared to similar influencers. This metric relates the number of comments per post to the influencer’s total followers. A high value suggests that the content is interesting, engaging, and less superficial, indicating a stronger connection between the influencer and their followers.
- Follower Growth: Measures follower growth over the last 30 days compared to similar influencers. This metric shows the growth of the influencer over the last 30 days, and the bar chart also displays how this growth compares with influencers of similar follower size. In our experience, growth is one of the most telling indicators of an influencer’s quality. High follower growth has a positive effect on most other scores and is a reliable predictor of campaign success.
- Average Plays per Reel: Shows the average number of plays per reel compared to similar influencers.
- Reel Engagement: Indicates the percentage of viewers who interact with reels compared to similar influencers. This metric relates the engagement—likes and comments—of the reels to the influencer’s average reel plays.
- Average Watch Time per Reel: Shows the average watch time per reel compared to similar influencers. This metric indicates how many hours a reel is watched on average by all users. High watch time suggests that the influencer’s reels are not only viewed but watched until the end, making them particularly interesting for campaigns.
For these scores, it depends on which criteria are important for you and your campaign, but values above 5 are recommended.
7. How to assess an influencers authenticity and sponsored content?
Authenticity Analysis:
- Percentage of Suspicious and Mass Followers: The percentage of suspicious and mass followers gives you insight into how many of an influencer’s followers might be questionable compared to similar influencers. This metric helps you understand how many followers are flagged as either suspicious or inactive, with a bar chart that lets you see how they stack up against influencers with a similar follower count. Inactive followers don’t show any activity, either on their own account or with the influencers they follow. Suspicious profiles often lack a profile picture, have very few followers, and usually feature a generic bio with minimal posts. These types of followers aren’t valuable for advertising. We recommend working with influencers who have less than 30% suspicious or mass followers.
- Suspicious Activities Section: In the “Suspicious Activities” section, you’ll see if there have been any red flags like follow-unfollow activities or fake followers linked to this influencer. We look into common methods that might be used to boost follower numbers or engagement unnaturally. These activities are usually only flagged if they have a significant impact on the account or have been ongoing for a while. If the suspicious activity occurred a long time ago, it won’t show up here. Note: These actions may not always be directly taken by the influencer. For instance, someone could buy fake followers for any account, potentially to harm the influencer’s reputation.

Sponsored Posts: The sponsored posts section shows the percentage of posts, stories, and reels that contain brand mentions. These metrics show how many of the influencer’s content pieces mention a brand. An ideal balance is key: too high a percentage of sponsored content might suggest that followers are primarily seeing ads, which could reduce their interest. Conversely, too low a percentage might indicate that the influencer isn’t producing enough sponsored content to be attractive for collaborations.

8. Which brands has the influencer worked with recently?
The Brand Mentions section shows which brands the influencer has collaborated with in the last 365 days, how many brand mentions were shared, and the Earn ed Media Value (EMV) generated. This is particularly helpful to see if there were collaborations with competitors or if the influencer has experience in your niche.
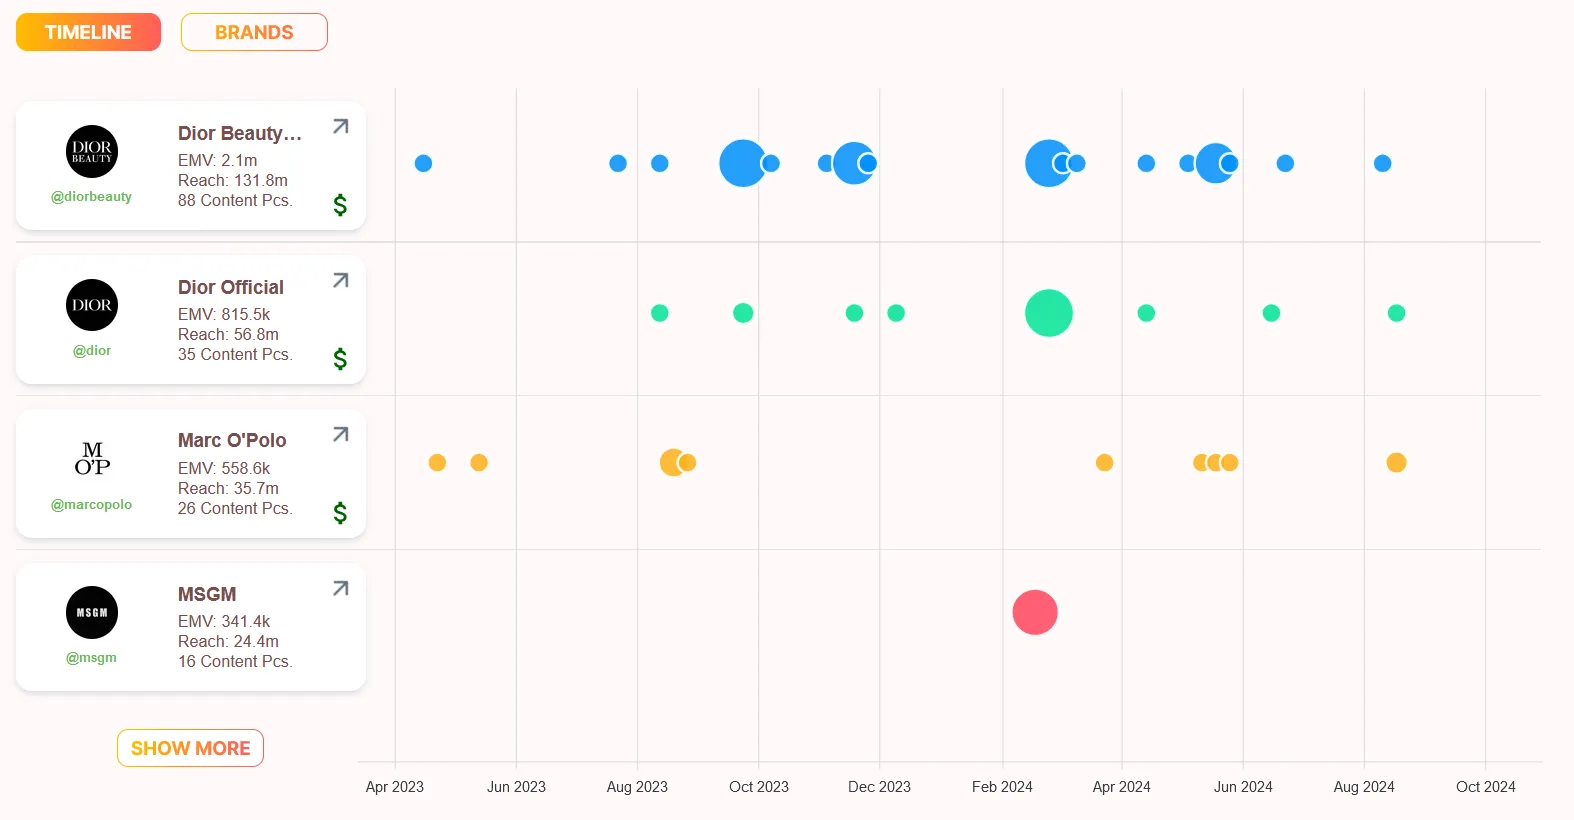
You can also take a look at the individual brand collaborations to get a better insight into the content.

9. What does a collaboration with this influencer cost?
The Smart Media Value indicates the estimated prices for posts, stories, and reels for an influencer in Euros or US Dollars. These values serve as an indicator of how much you might expect to pay for a content piece from this influencer. However, please note that this is only a rough estimate. The actual price is determined during negotiations with the influencer and depends on various factors, such as the scope and complexity of the project, the duration of the collaboration, and other individual conditions.

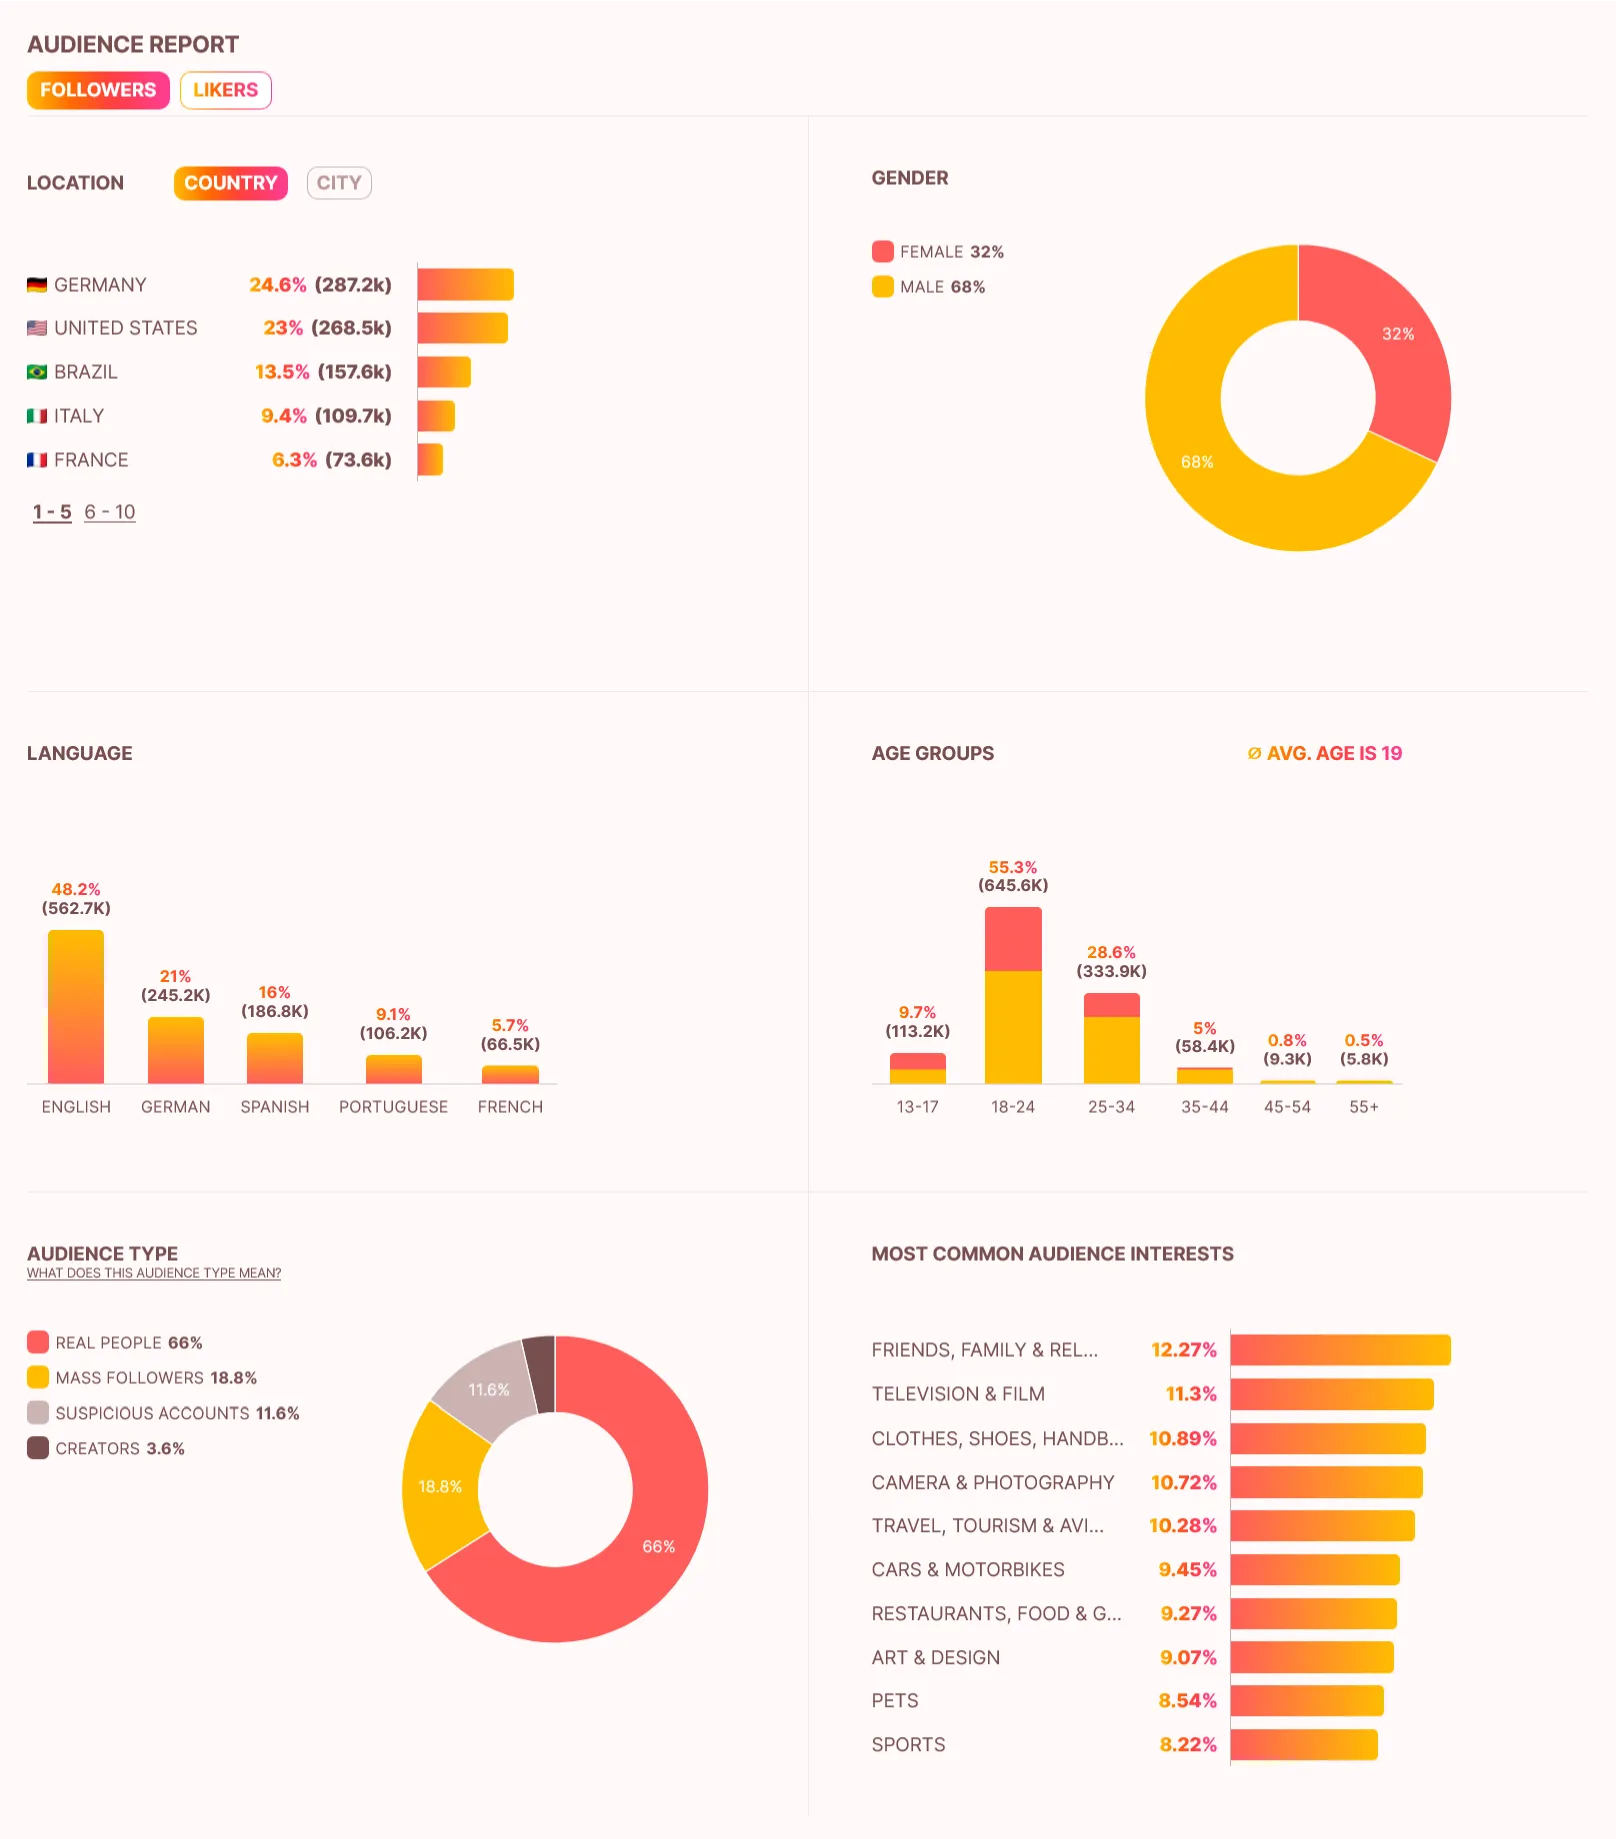
10. What does the influencer’s audience look like?
The Audience Report provides detailed information about the origin, gender, and age of the influencer’s audience. Additionally, it highlights the most common interests of the audience, including frequently mentioned brands and topics.
The audience breakdown reveals the proportion of a creator’s followers that are genuine followers, suspicious/inactive followers, mass followers, or creators. This breakdown helps assess the quality and authenticity of an influencer and their community, offering insights that go far beyond simple follower numbers. Genuine followers display active and healthy behavior, typical of regular accounts. These active and authentic users usually engage well with the content, making them high-quality followers. Suspicious or inactive followers are accounts that are likely not operated by real people, as they often lack a biography, profile picture, or activity on the platform. A high proportion of such profiles often points to fake followers or manipulation. Mass followers are accounts that follow more than 1,500 people and, as a result, do not behave like traditional followers. Creator followers are accounts with over 2,000 followers themselves, meaning they are also not standard followers. While creator followers can contribute to network effects, they are often less relevant for your target audience.
